Shopping cart
Your cart empty!
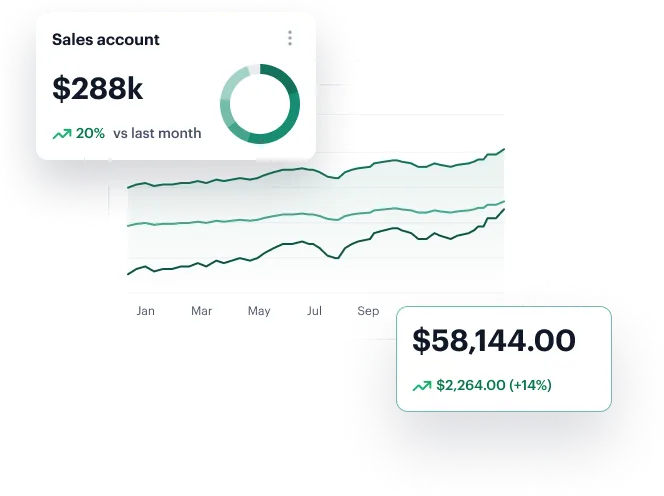
Lighthouse is Powered by powerful, flexible, and intuitive dashboard builder HALO. Visualize everything from single sensor’s data to enterprise-wide metrics.


Custom dashboards, visual analytics, and device insights—crafted in minutes with drag-and-drop simplicity.
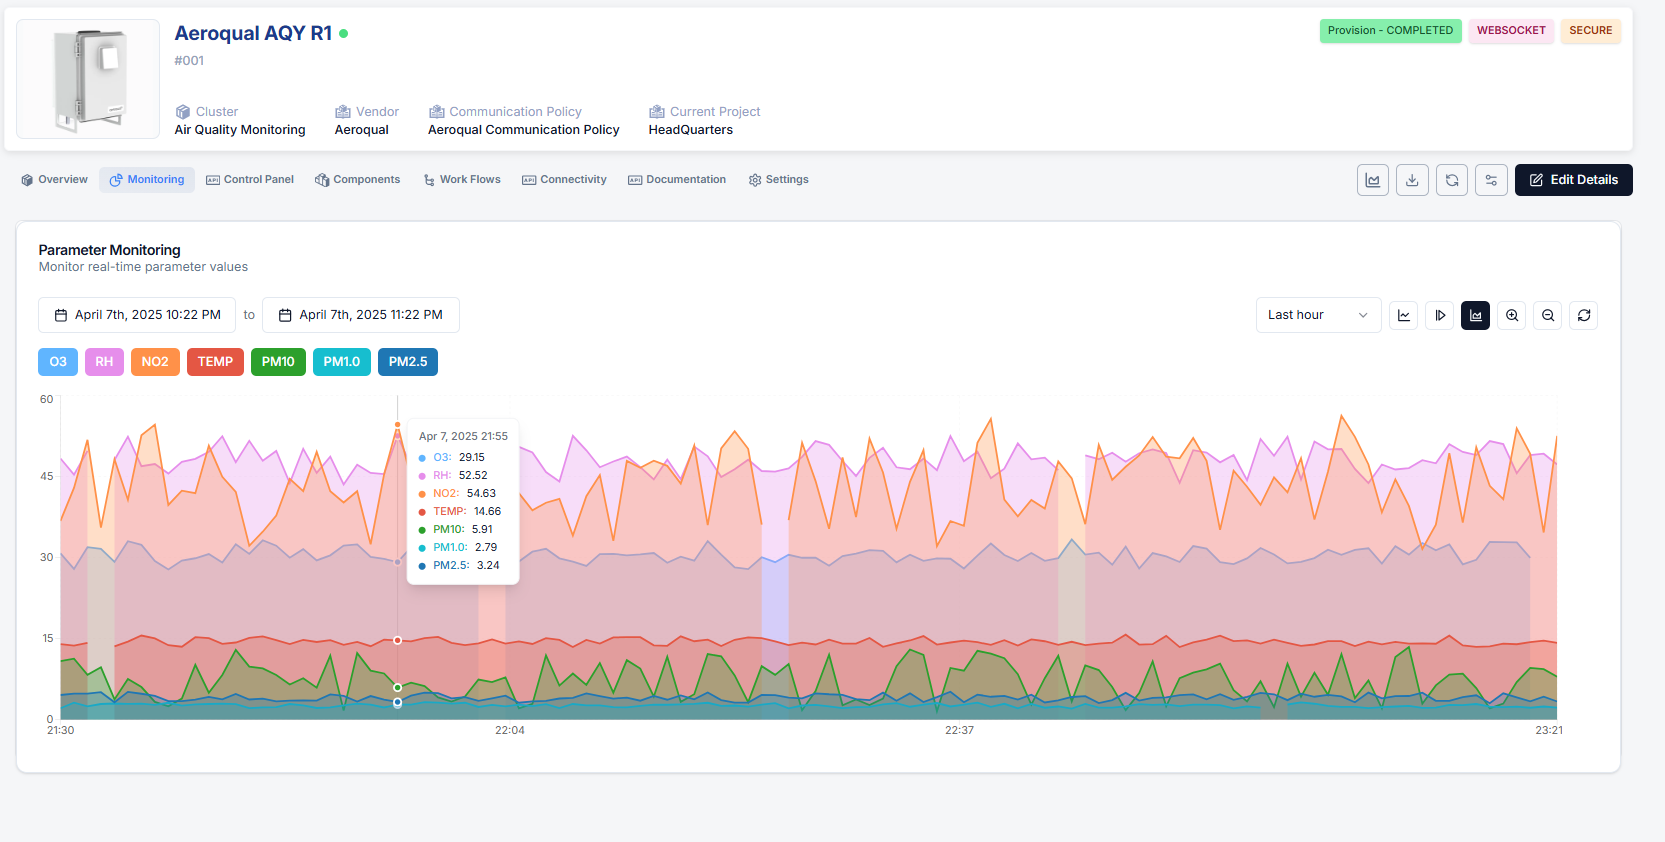
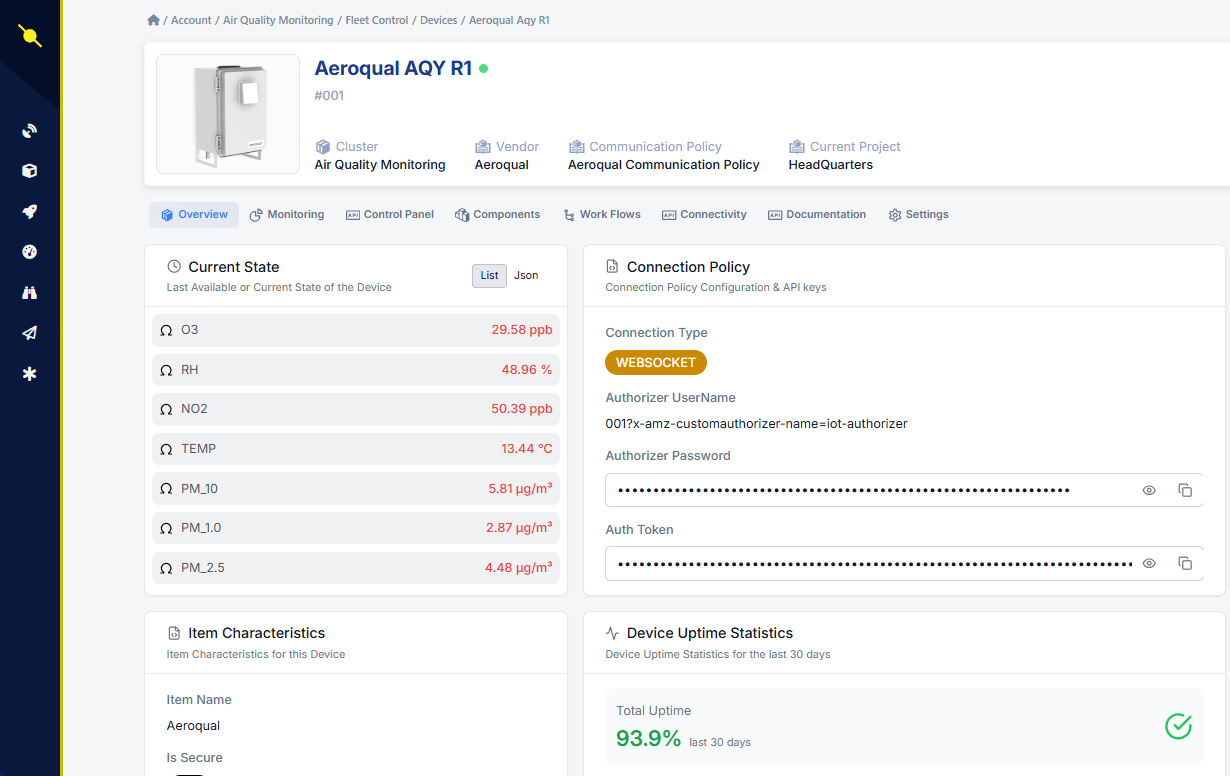
Choose from charts, gauges, tables, heatmaps, map overlays, and more. Each widget is configurable with thresholds, dynamic colors, and real-time data bindings.
No code required. Just drag components onto the canvas, bind them to data streams, and go live in minutes.
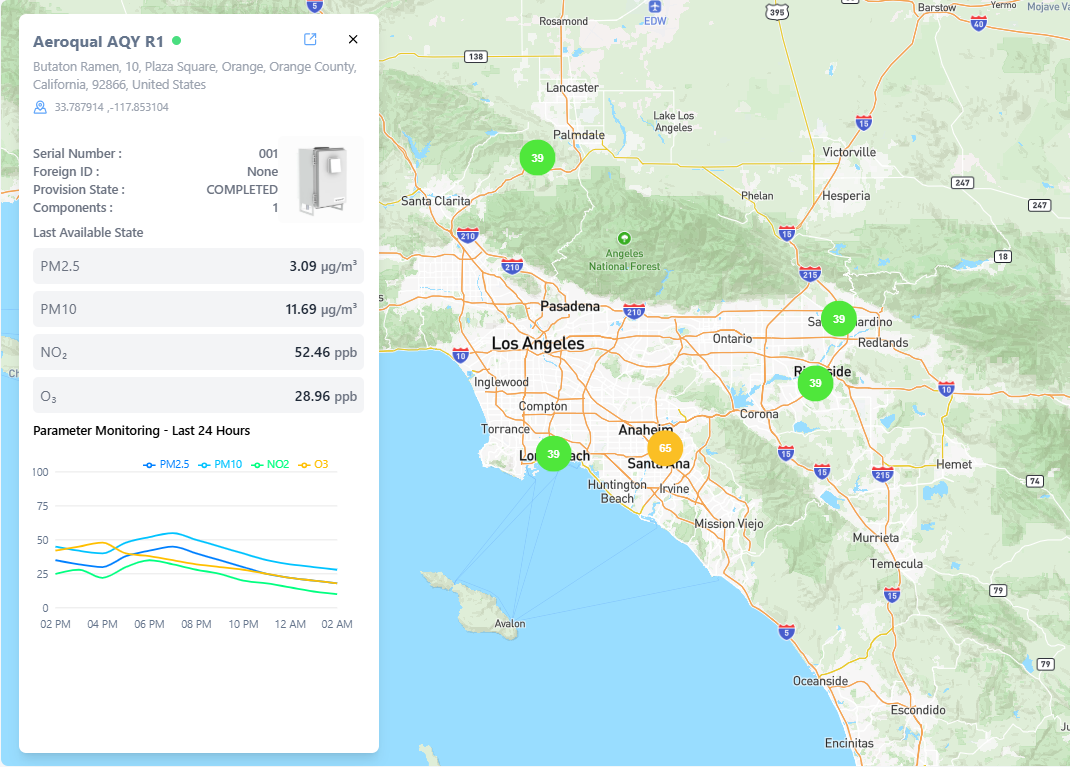
Combine data from multiple devices, sites, or types (e.g. temperature sensors + occupancy + energy usage) into unified views.
Easily switch between real-time streaming data and historical analytics to monitor trends or diagnose past issues.

Join 10k+ people to get notified about new posts, news and updates.
Do not worry we don't spam!